Feature Volcano Plots
Feature 2
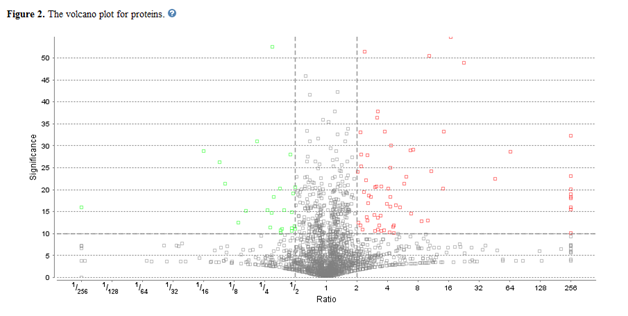
Feature volcano plots combines the results of the statistical significance test with the magnitude of the fold change. This enables quick visual identification of proteins (seen as data points) that are statistically significant and display large-magnitude fold changes. The horizontal dashed grey line represents the selected significance threshold. The vertical broken grey lines correspond to the up-regulated and down-regulated fold change thresholds. These three lines separate the plot into six regions, two of which are important. Data points that are found in both the top-right and the top-left sections of this plot correspond to proteins that are statistically significant and beyond the set fold change threshold. These proteins are likely quantifiably important and should be further examined. Green color represent down-regulated proteins and red color represent up-regulated proteins.

The Protein View contains this volcano plot that can be hidden or displayed. It is interactive, allowing users to select the coloured proteins (above the set significance threshold). Clicking on a marker will highlight the protein in the spreadsheet.

